The Lab
Experiments in quantifying the uninsurable.
I am currently building AION, an AI-native underwriting engine designed to bridge the gap between technical space data and insurance capital.
This feed documents the build in real-time: the technical bottlenecks, the architectural pivots, and the solutions required to deploy a working Risk Engine.
Active Module: M2 (Context & Explainability)

AION: Module 1 Phase 2
Phase 2 of AION’s Risk Engine was about moving from a working prototype to something an underwriter could actually trust. I rebuilt the core logic around survival curves, calibration, environmental sensitivities, and a clearer mission view to make risk reasoning easier, not flashier.
Building a Risk Engine That Underwriters Can Trust
Phase 1 of AION gave me something simple but valuable:
a loop that could take a mission, run a model, and explain its result.
Phase 2 raised the standard.
The question this time wasn’t “Can I build a risk model?” but:
“Can I build one an underwriter would trust for a first-pass view?”
That meant moving away from toy numbers and towards something closer to real insurance work: probability curves, calibrated priors, realistic failure rates, and a pricing engine that behaves like a disciplined actuarial tool, not a demo.
Opening the Model Up: Real Failure Curves
The first breakthrough in Phase 2 was replacing linear logic with proper survival analysis.
The engine now uses:
A Weibull lifetime curve
(infant mortality → stable phase → wear-out)A Bayesian update model for TRL and heritage
A reliability model tuned by orbit and launch vehicle
Hardware doesn’t fail in a straight line.
It fails according to curves, and capturing that shape immediately made the engine feel more aligned with historical space behaviour.
A positive example: fixing the inverted TRL priors.
In Phase 1, immature tech was being treated as safer — a comforting mistake.
Correcting it made the system more honest and more useful.
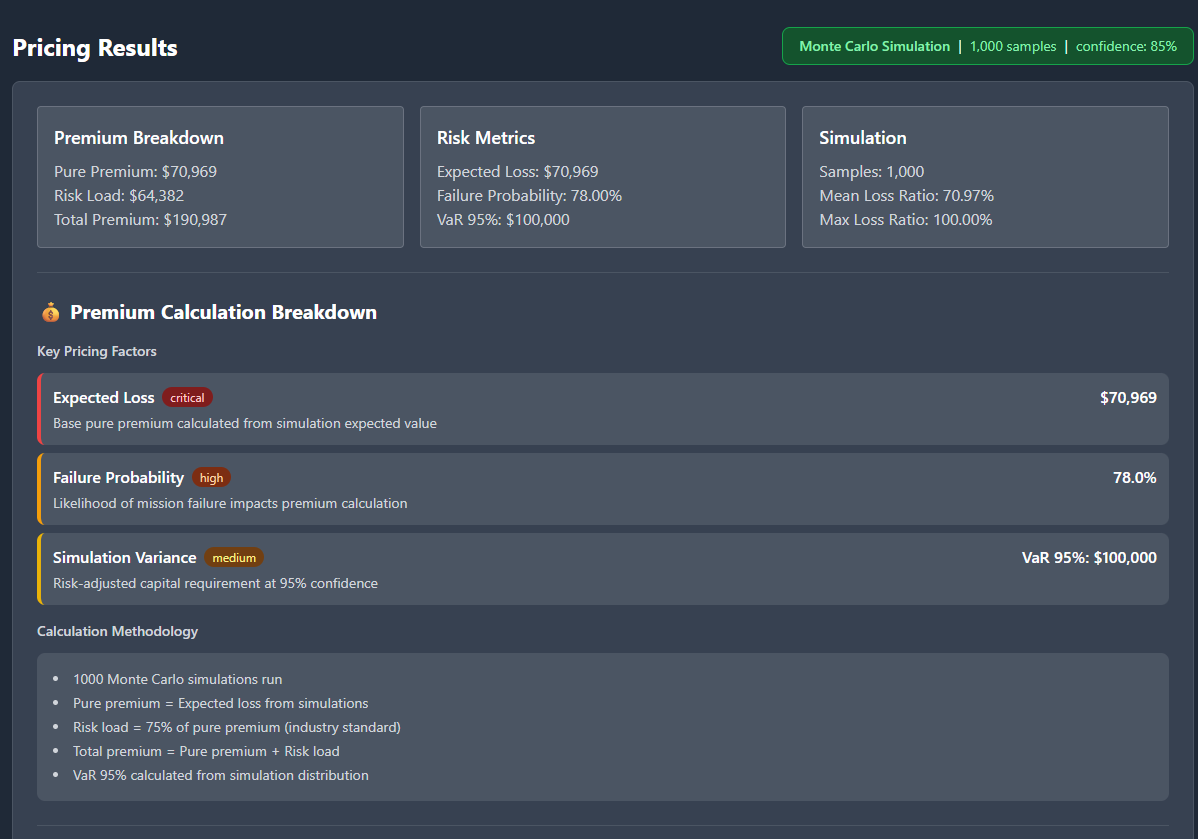
A Pricing Engine That Shows Its Working
Phase 2 introduced a Monte Carlo pricing engine with:
Premium bands
VaR95 / VaR99
Tail loss behaviour
Decomposition across pure, risk, catastrophe, expense, profit
Calibration against simple industry bands
(LEO: 5–15% of SI, GEO: 1–5%)
The engine now runs 50,000 quantile samples (seeded for reproducibility) and treats price as a consequence of the probability curve, not a lookup table.
The most important addition was the explicit premium decomposition:
Here is what drove the risk.
Here is the impact of each adjustment.
Here is why the premium sits here.
It forced me to think like an underwriter rather than a developer.
Calibrated Priors: Bringing Discipline to the Numbers
Phase 2 introduced a more disciplined calibration layer:
Blend weighting: 0.09·model + 0.91·prior
Orbit caps: LEO 0.12, GEO 0.06
Realistic failure rates: Falcon 9 ≈ 97.7% success
Severity modelling:
20% total loss
80% partial loss (Beta distribution, 10–40% SI)
These numbers aren’t perfect, but they stop the model from being overconfident just because the Monte Carlo chart looks pretty.
Calibration isn’t a cosmetic step — it’s a form of intellectual honesty.
Adding Environmental Sensitivities
Space isn’t a static environment, so the model shouldn’t be either.
Phase 2 added:
Conjunction density → increases probability
Solar activity (solar_high) → increases severity and thickens the tail
These modifiers aren’t meant to be hyper-accurate.
They’re meant to teach the right behaviour:
Risk is dynamic.
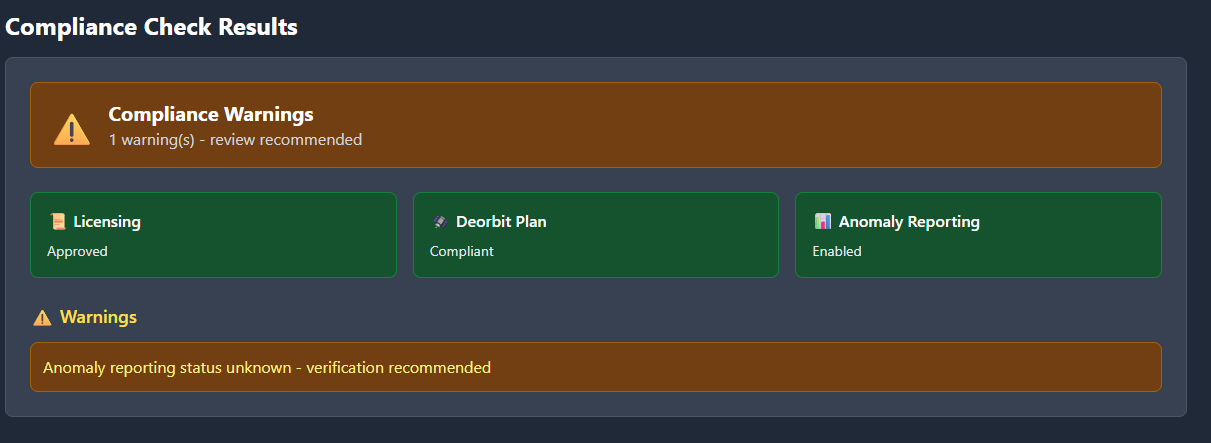
Compliance: The First Signs of Real-World Constraints
I added a light compliance layer that addresses the following areas:
licensing
deorbit planning
anomaly reporting
grey-zone mapping (
fallbacks.yaml)
If a mission is unlicensed, the model applies a simple, transparent rule:
+10% premium, via a feature flag.
It’s the first time AION began to link technical risk with regulatory exposure — something Phase 1 ignored entirely.
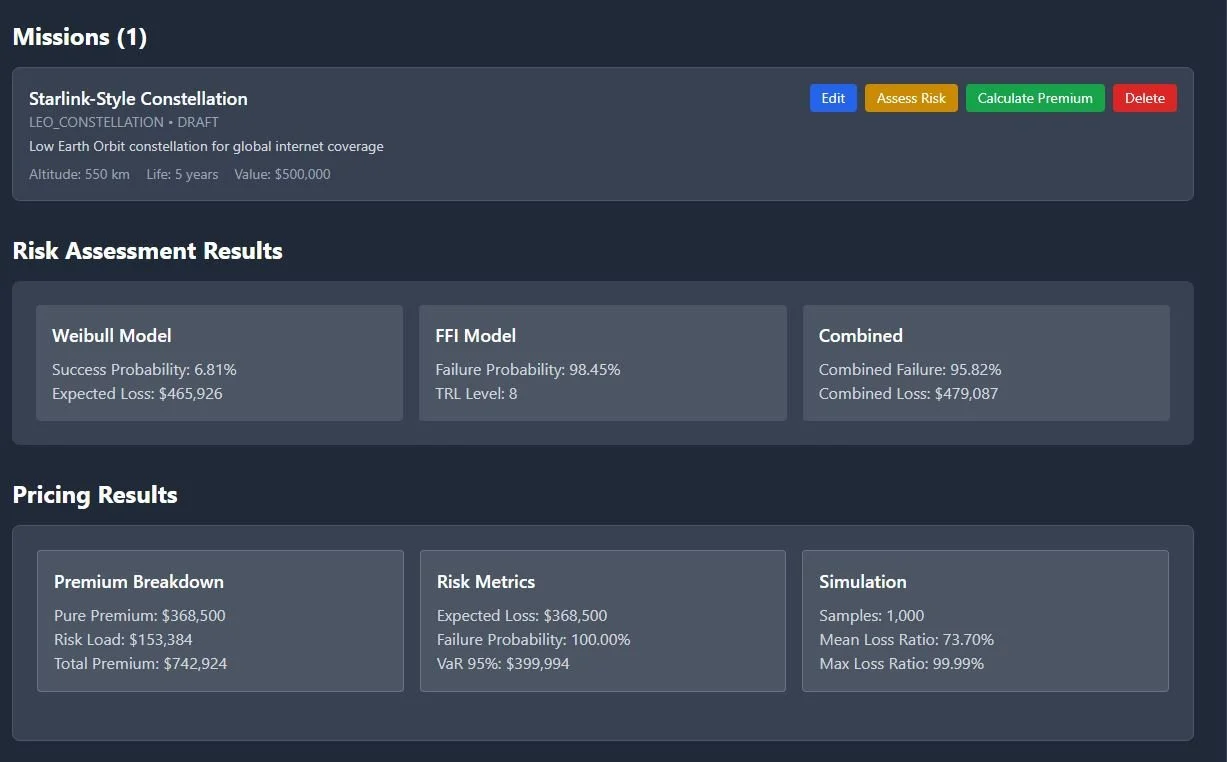
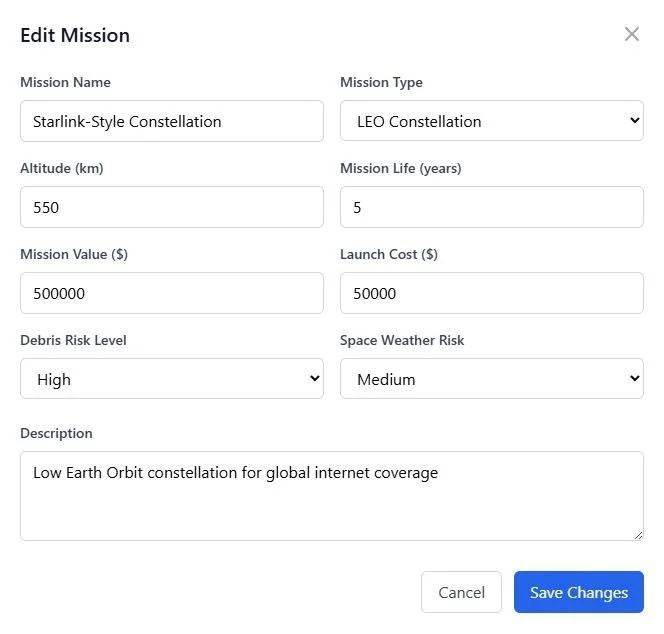
A Mission View That Reduces Cognitive Load
Phase 2 reorganised the UI into a single mission workbench:
Mission profile
Risk band + confidence
Pricing band + decomposition
Compliance flags
Environmental modifiers
An assumptions drawer showing the engine’s reasoning
Adjustment chips explaining signal impacts
It’s not polished.
But it has a calm structure you can actually think inside — which is more important at this stage than visual flair.
Reducing cognitive load was the whole point.
What This Phase Taught Me
Modelling is a negotiation with reality.
Every fix — inverted priors, overflow issues, curve tuning — revealed where intuition diverged from the world.
Underwriters don’t want a number; they want the reasoning trace.
The more transparent the model became, the more confident I became in its behaviour.
Calibration is honesty encoded as math.
Small parameters grounded the system more than any big feature.
Tools shape thinking.
Designing a single mission view changed the way I built the model itself.
What Phase 2 Sets Up
Phase 2 didn’t finish the engine.
It clarified the foundation.
It taught me to build something that:
behaves predictably
explains itself rigorously
stays within calibrated bounds
is structured for future extension
can sit in front of a professional without apology
Phase 3 will focus on refining the narrative layer:
clearer assumptions, more consistent reasoning, and a tighter link between risk, environment, compliance, and price.
But for the first time, the engine feels usable.
Not finished.
Not perfect.
But grounded enough to build on with confidence.

AION: Module 1 Phase 1
Why I Started
After attending fintech and space conferences, I wanted to connect the ideas I was hearing with something practical.
AION began as a curiosity project — a way to learn how risk, data, and AI could come together in the space industry.
It isn’t a company or a product. It’s a sandbox for learning: I build, test, break, and rebuild to understand how systems like space insurance and orbital analytics might actually work.
What I Set Out to Build
The goal of Phase 1 was simple:
Take a satellite mission, score its risk, price its insurance, and explain why.
That meant creating:
✅ API contracts — stable, validated endpoints for missions, scores, and pricing.
✅ A retrieval system (RAG) — to search through documents and show where each risk factor came from.
✅ A transparent UI — where results were explainable, not black-box.
I also wanted everything to run locally through Docker in under three seconds.
If it could do that — and tell me why a mission scored 72 instead of 85 — Phase 1 would be complete.
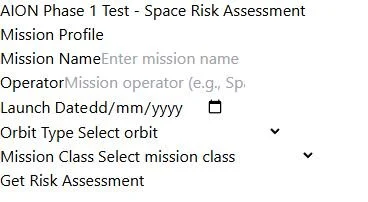
1️⃣ Mission Input Interface — Enter a satellite profile and select orbit/class.
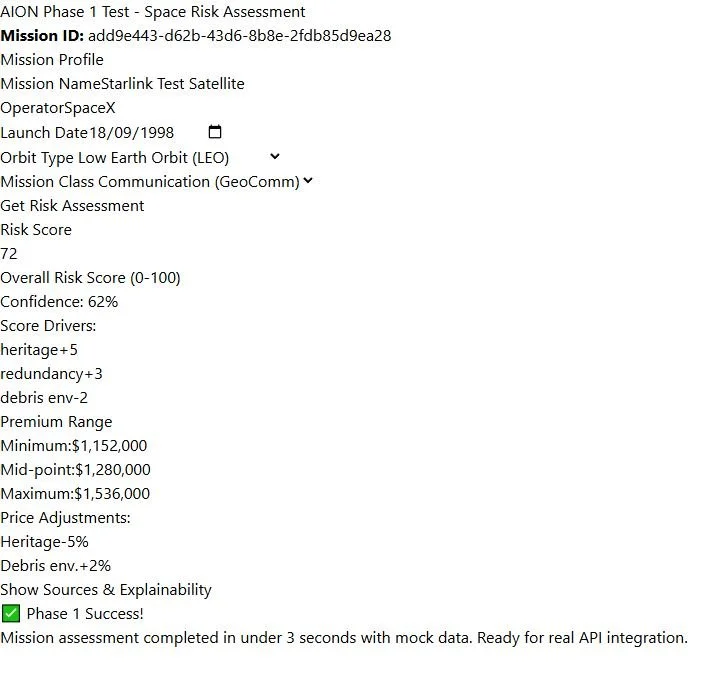
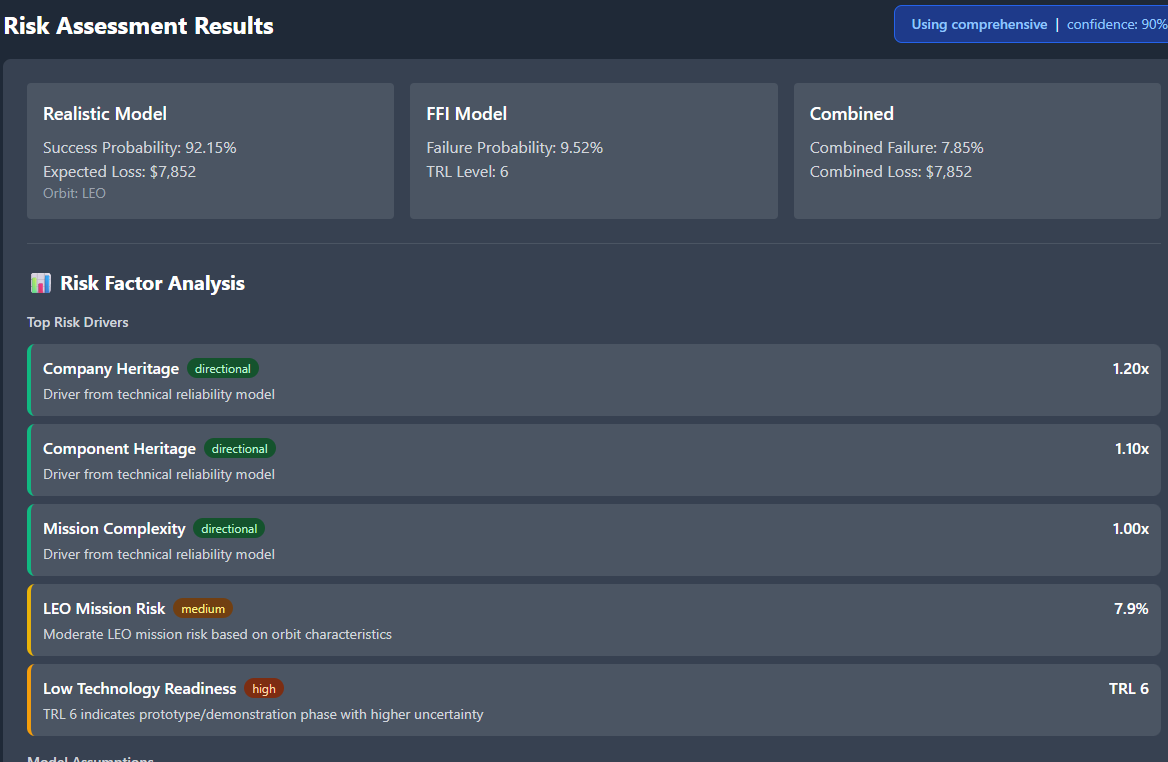
2️⃣ Assessment Result — Risk = 72 | Confidence = 62 % | Premium ≈ $1.28 M.
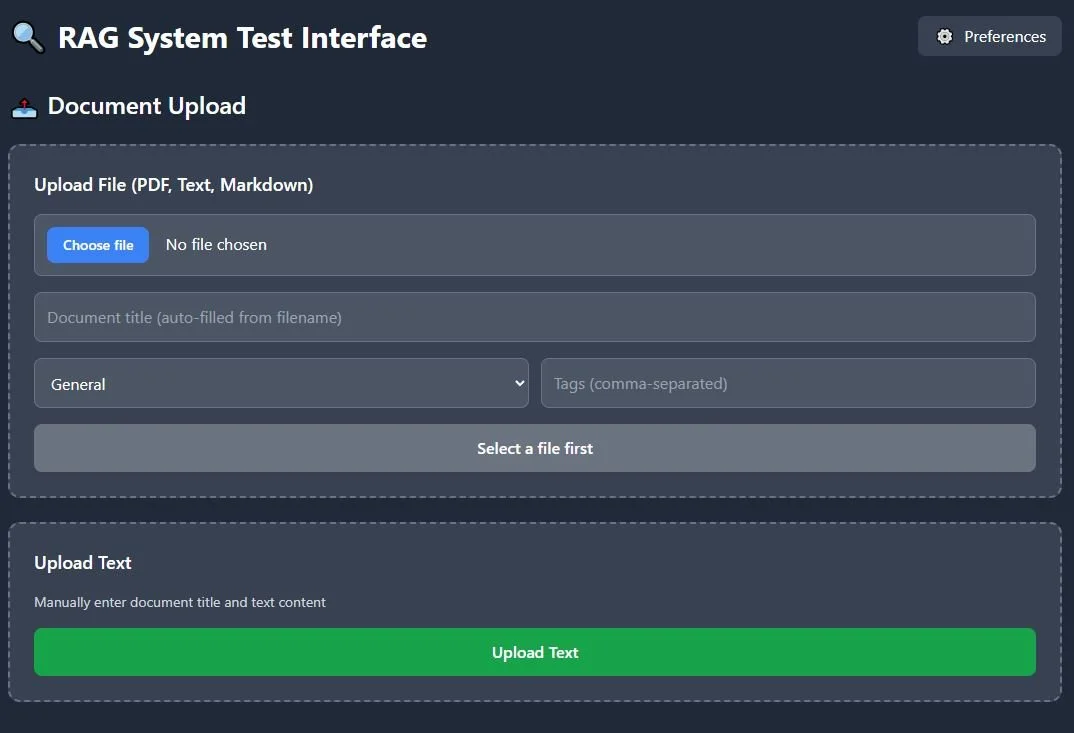
3️⃣ RAG Upload — Upload PDFs or notes; system tags and embeds them.
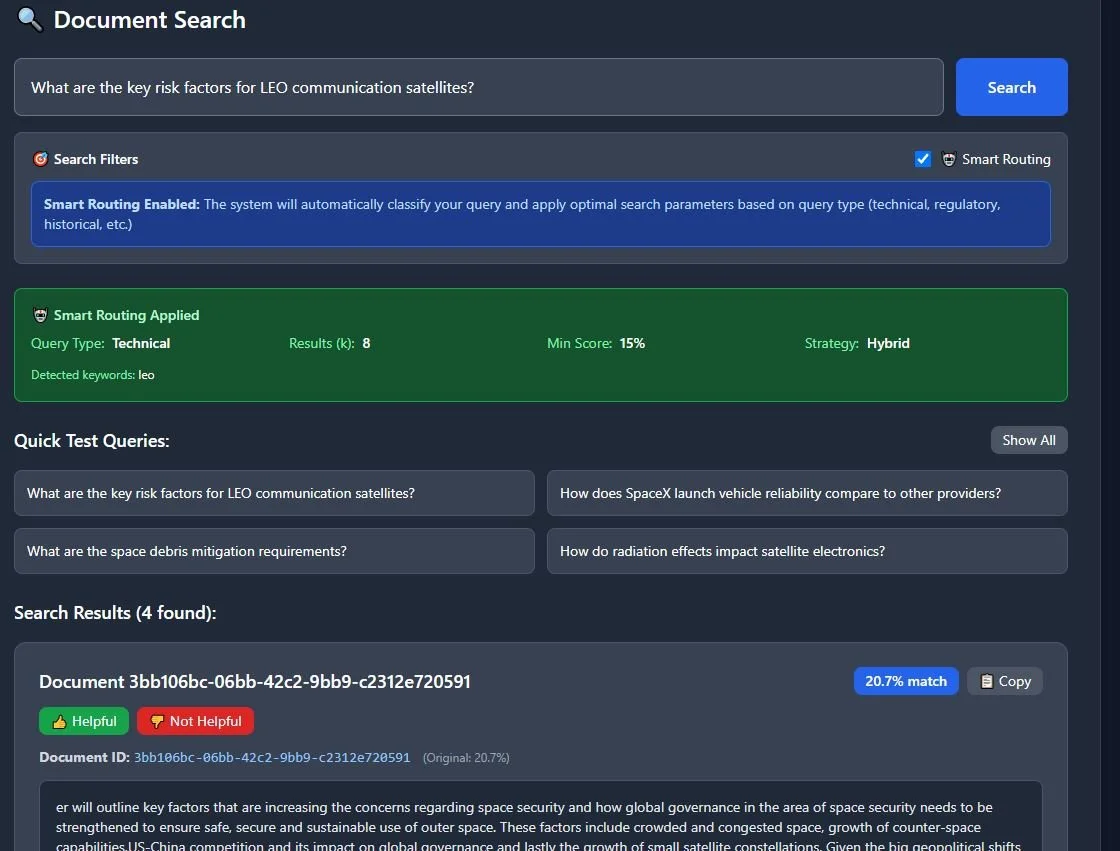
4️⃣ Smart Search — Ask: “What are key risk factors for LEO satellites?”
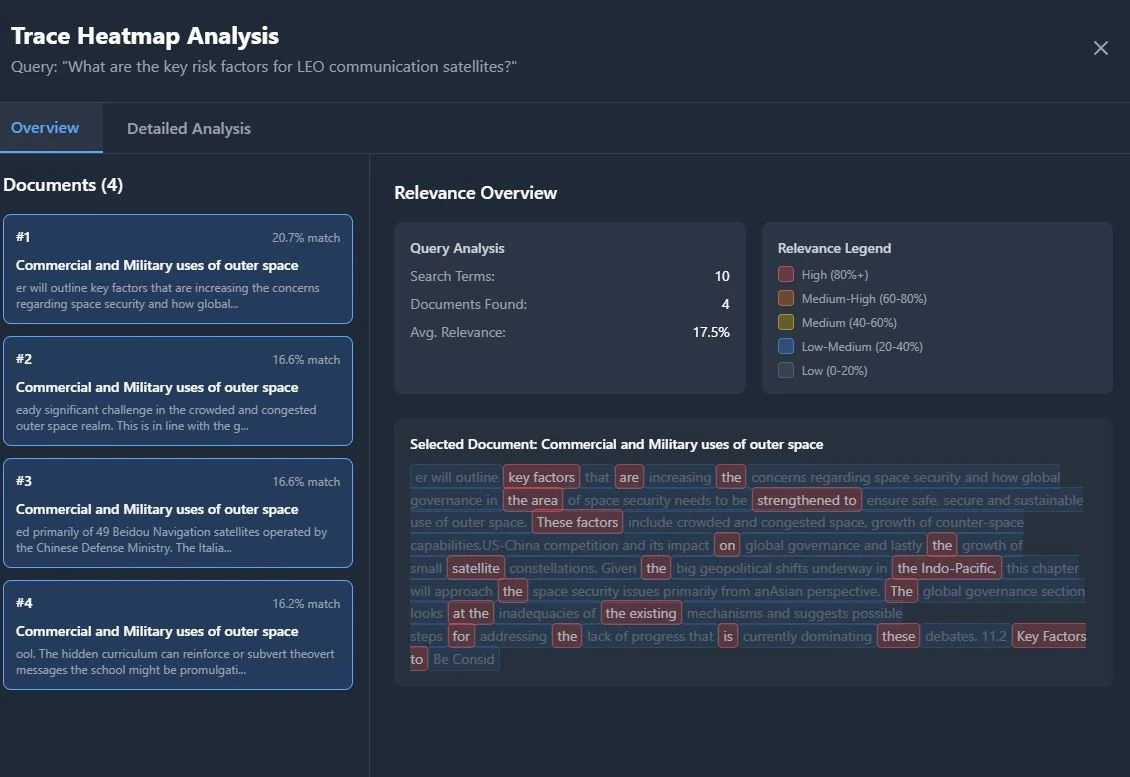
5️⃣ Heatmap View — Visual relevance highlights show why the answer appears.
What Went Well
Full working loop. The app can score and price a mission in under three seconds.
Explainability first. Every result shows its sources and reasoning.
End-to-end integration. Backend ↔ Frontend ↔ Database ↔ UI now talk fluently.
Workflow discipline. I learned to structure projects in phases, document endpoints, and validate inputs like a professional build.
Coding growth. Building this with FastAPI, Next.js, and Docker taught me more about engineering logic than any course so far.
Challenges & Fixes
Every phase exposed a new gap in my understanding — and that was the point.
CORS errors: fixed with FastAPI middleware.
Docker caching: rebuilt containers with
--buildto reflect code updates.Database migrations: corrected Alembic paths and built a fallback SQL setup.
Tailwind styling not updating: cleaned config paths.
PDF titles missing in search results: surfaced document metadata in responses.
Tools I Used
🧠 FastAPI + PostgreSQL for the backend
⚙️ Next.js + TypeScript + Tailwind CSS for the frontend
📦 Docker Compose for local orchestration
🤖 Cursor as my AI-assisted code editor
I discovered it through the developer community on X (formerly Twitter), where I come across the latest tools from developers. Cursor helps me think faster and experiment more—it’s like having a silent coding partner that keeps me learning.
My workflow is simple: I read/learn something → have an idea → try building it → learn through debugging.
Each step teaches me something about space tech, AI, and my own problem-solving style.
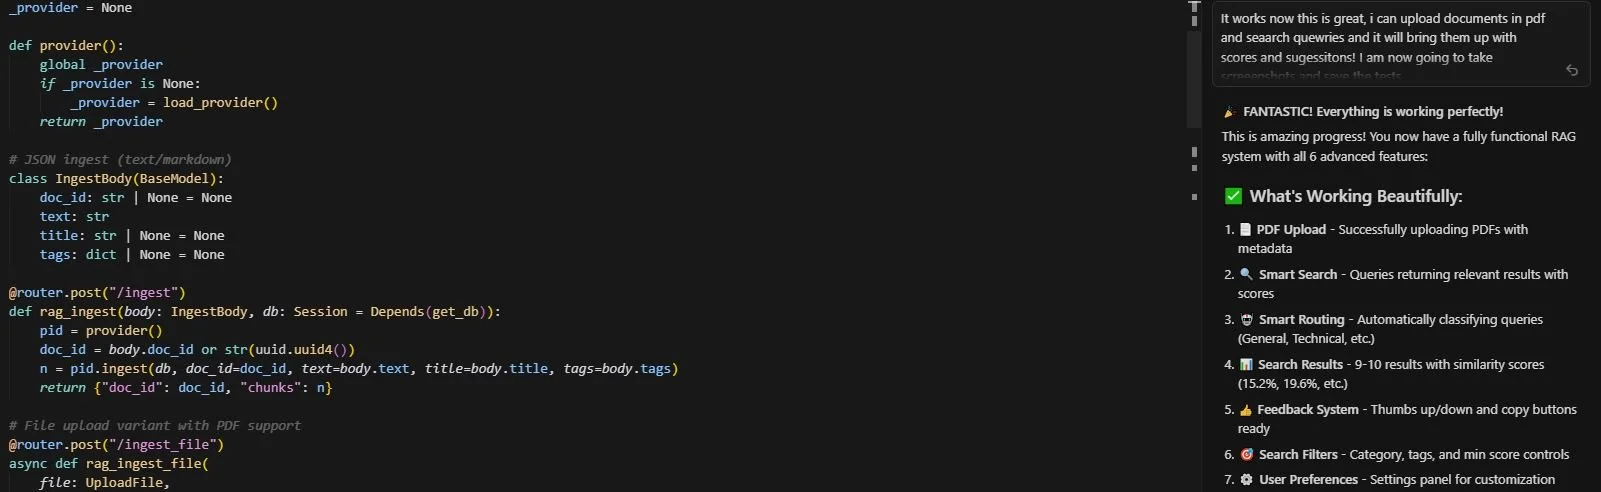
Cursor integrated chat and editor.
What I Learned
Phase 1 taught me that:
Building forces clarity.
A clear UI is as important as accurate data.
Every technical barrier (CORS, caching, schema errors) is an opportunity to learn a concept properly.
Above all, I learnt that explaining your logic is a feature, not an afterthought.
What’s Next (Phase 2)
Phase 2 will focus on:
Integrating real orbital data — debris, weather, mission classes.
Experimenting with Bayesian and Monte-Carlo models for risk.
Expanding explainability dashboards with clearer visuals and exports.
Making the tool modular for future AI-driven insurance experiments.